
| 일 | 월 | 화 | 수 | 목 | 금 | 토 |
|---|---|---|---|---|---|---|
| 1 | 2 | 3 | 4 | 5 | ||
| 6 | 7 | 8 | 9 | 10 | 11 | 12 |
| 13 | 14 | 15 | 16 | 17 | 18 | 19 |
| 20 | 21 | 22 | 23 | 24 | 25 | 26 |
| 27 | 28 | 29 | 30 |
- 중식
- 달리기
- 정보처리기사
- zabbix
- Kubernetes
- Python
- 힐링
- Grafana
- 10km
- docker
- 성수대교
- Linux
- 2021
- DSEC
- 소모임
- 하체
- Podman
- 러닝
- 유산소
- GitHub
- 자전거
- 뚝섬유원지
- 대전
- 한강
- 건대입구역
- 대구
- 오답노트
- Run The Bridge
- 맛집
- Shell
- Today
- Total
Run The Bridge
kubernetes project -8-(종료) 본문
0. 들어가기에 앞서
11월 9일 발표를 마지막으로 쿠버네티스 엔지니어 양성과정을 끝마쳤다.
마지막으로 블로그+github에 그간 작성해온 yaml파일을 정리하고, 누군가에게 도움을 줄 수 있으니 포스팅을 해본다.
1. zabbix data를 정리할 mysql 올리기
우선 나는 NFS를 잡아서 데이터들을 3개의 Node에서 모두 접근하도록 만들어놓았다.
NFS 만드는 방법은 예전에 올린 블로그 글을 참여하거나 구글링을 통해 손쉽게 구현이 가능하다.
AWS를 쓰시는 사람은 AWS에서 제공하는 NFS서버가 존재하니 그걸 공부하셔서 적용하면 된다.
우선 Master와 Worker 2대를 사용한다.(서비스가 작기 때문에 온-프레미스도 상관없다.)
NFS dir를 만들어서 폴더를 생성하고 Data volume를 잡아주었다.

mysql.yaml파일은 다음과 같다.
# zabbix-mysql-server.yaml
apiVersion: apps/v1
kind: Deployment
metadata:
  name: zabbix-mysql-server
  namespace: zbx
spec:
  replicas: 1
  selector:
    matchLabels:
      app: zabbix-mysql-server
  strategy:
    type: Recreate
  template:
    metadata:
      labels:
        app: zabbix-mysql-server
    spec:
      containers:
        - name: zabbix-mysql-server
          image: mysql:5.7
          imagePullPolicy: Always
          env:
          - name: MYSQL_ROOT_PASSWORD
            valueFrom:
              secretKeyRef:
                name: mysql-user-pwd
                key: mysql-root-pwd
          ports:
          - containerPort: 3306
          volumeMounts:
          - name: mysql-volume
            mountPath: /var/lib/mysql

      volumes:
      - name: timezone
        hostPath:
          path: /usr/share/zoneinfo/Asia/Seoul
      - name: mysql-volume
        persistentVolumeClaim:
          claimName: mysql-pv-claim
위의 yaml파일을 'k apply -f'로 올리면 mysql이 올라간다.
mysql-secret.yaml은 다음과 같다.
mysql을 올리기 위해선 root-password을 설정해주어야 한다. 직접 설정해도 되지만 우리는 secret파일을 만들자.
apiVersion: v1
kind: Secret
metadata:
  name: mysql-user-pwd
  namespace: zbx
data:
  mysql-root-pwd: cGFzc3dvcmQ=
mysql-volume.yaml은 다음과 같다.(pv, pvc)
위에서 NFS설정을 잡았기 때문에 nfs-server를 지정해주고 경로를 잡아준다.
resources는 자신의 서버 resources에 맞게 설정하면 된다.
apiVersion: v1
kind: PersistentVolume
metadata:
  name: mysql-pv-volume
#  labels:
#    type: mysql-pv
spec:
  capacity:
    storage: 20Gi
  accessModes:
    - ReadWriteOnce
  nfs:
    server: 192.168.16.142
    path: /nfs/mysql-data

---
apiVersion: v1
kind: PersistentVolumeClaim
metadata:
  name: mysql-pv-claim
  namespace: zbx
spec:
  storageClassName: ""
  accessModes:
    - ReadWriteOnce
  resources:
    requests:
      storage: 20Gi
#  selector:
#    matchLabels:
#      name: mysql-pv
이제 pod간 통신을 위해서 service을 열어준다.
mysql-service.yaml 파일은 다음과 같다.
Nodeport로 설정했지만 mysql 같은 서버는 온프레미스로 구축하거나, ClusterIP로 잡아주어야 한다.
apiVersion: v1
kind: Service
metadata:
  name: mysql-db
  namespace: zbx
spec:
  type: NodePort
  ports:
  - port: 3306
    protocol: TCP
    targetPort: 3306
    nodePort: 30006
  selector:
    app: zabbix-mysql-server
  type: NodePort
순서는 다음과 같이 올리면 된다.(물론 더 좋은 방식으로 구축하는 방법이 있을 수 있다.)
kubectl apply -f mysql-secret.yaml # root password용 secretkubectl apply -f mysql-service.yaml # pod간 통신을 위한 servicekubectl apply -f mysql-volume.yaml # Data 저장kubectl apply -f zabbix-mysql-server.yaml # server 올리기※ zabbix databases 생성 및 권한 설정
Databases를 올렸으면 zabbix가 쓸 계정 및 권한을 설정해주어야 한다.(Pod안으로 접속해야 한다.)
create database zabbix character set utf8 collate utf8_bin;

create user 'zabbix'@'%' identified by 'zabbix';

create user 'zabbix'@'localhost' identified by 'zabbix';

flush privileges;

grant all privileges on zabbix.* to 'zabbix'@'%';

grant all privileges on zabbix.* to 'zabbix'@'localhost';

use mysql

grant all privileges on *.* to 'root'@'%' identified by 'password';
2. zabbix-server 올리기
이제 zabbix 데이터를 저장할 db를 올렸기 때문에 zabbix server을 올려서 서로 연동시켜준다.
zabbix server의 OS는 공식문서를 참조하면 ENV설정에 어떤 것이 있는지 확인이 가능하다.
https://www.zabbix.com/container_images
Zabbix Docker images
www.zabbix.com
zabbix server의 yaml파일은 다음과 같다.
특별하게 두 개의 image가 한 개의 Container에 올라가 있는데, zabbix server와 정보를 받아오기 위한 agent이다.
apiVersion: apps/v1
kind: Deployment
metadata:
  name: zabbix-server
  namespace: zbx
spec:
  replicas: 1
  selector:
    matchLabels:
      app: zabbix-server
  template:
    metadata:
      labels:
        app: zabbix-server
    spec:
      containers:
        - name: zabbix-server
          image: zabbix/zabbix-server-mysql:ubuntu-5.4-latest
          imagePullPolicy: Always
          ports:
          - name: zbx-server
            containerPort: 10051
            protocol: TCP
          env:
          - name: DB_SERVER_HOST
            value: "mysql-db"
          - name: DB_SERVER_PORT
            value: "3306"
          - name: MYSQL_USER
            value: "zabbix"
          - name: MYSQL_PASSWORD
            value: "zabbix"
          - name: MYSQL_DATABASE
            value: "zabbix"
#          - name: DEBUG_MODE
#            value: "true"
#          - name: ZBX_DB_ENCRYPTION
#            value: "true"
          - name: ZBX_STATSALLOWEDIP
            value: "0.0.0.0/0"
        - name: zabbix-agent
          image: zabbix/zabbix-agent:ubuntu-5.4-latest
          imagePullPolicy: Always
          ports:
          - containerPort: 10050
            name: zabbix-agent
          env:
          - name: ZBX_HOSTNAME
            value: "Zabbix server"
          - name: ZBX_SERVER_HOST
            value: "127.0.0.1"
          - name: ZBX_SERVER_PORT
            value: "10051"
          - name: DEBUG_MODE
            value: "true"
zabbix server도 마찬가지로 service을 올려준다. 포트는 zabbix server의 기본 포트는 10051번
apiVersion: v1
kind: Service
metadata:
  name: zabbixserver
  namespace: zbx
spec:
  type: NodePort
  ports:
  - port:  10051
    targetPort: 10051
    protocol: TCP
    nodePort: 30051
  selector:
    app: zabbix-server
마지막으로 zabbix를 올릴 web.yaml을 올린다.
apiVersion: apps/v1
kind: Deployment
metadata:
  name: zabbix-web
  namespace: zbx
spec:
  replicas: 2
  selector:
    matchLabels:
      app: zabbix-web
  template:
    metadata:
      labels:
        app: zabbix-web
    spec:
      containers:
      - image: zabbix/zabbix-web-nginx-mysql:ubuntu-5.4-latest
        imagePullPolicy: Always
        name: zabbix-web
        ports:
        - name: zabbix-server
          containerPort: 80
        - name: grafana
          containerPort: 3000
        env:
        - name: DB_SERVER_HOST
          value: "mysql-db"
        - name:  ZBX_SERVER_HOST
          value: "zabbixserver"
        - name: ZBX_SERVER_PORT
          value: "10051"
        - name: MYSQL_USER
          value: "zabbix"
        - name: MYSQL_PASSWORD
          value: "zabbix"
        - name: ZBX_SERVER_NAME
          value: "zabbix"
        - name: TZ
          value: "Asia/Seoul"
        - name: DEBUG_MODE
          value: "true"
web도 마찬가지로 접속하기 위한 NodePort를 open 시켜준다.
apiVersion: v1
kind: Service
metadata:
  name: zabbix-web
  namespace: zbx
spec:
  type: NodePort
  ports:
  - name: zabbix-server
    port: 80
    protocol: TCP
    targetPort: 8080
    nodePort: 30080
  selector:
    app: zabbix-web
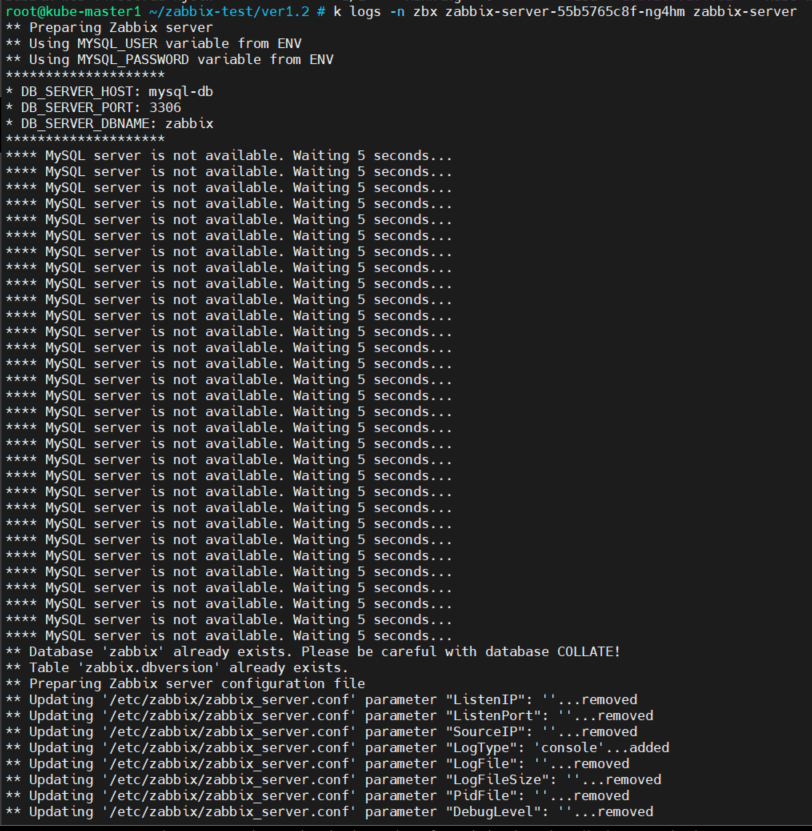
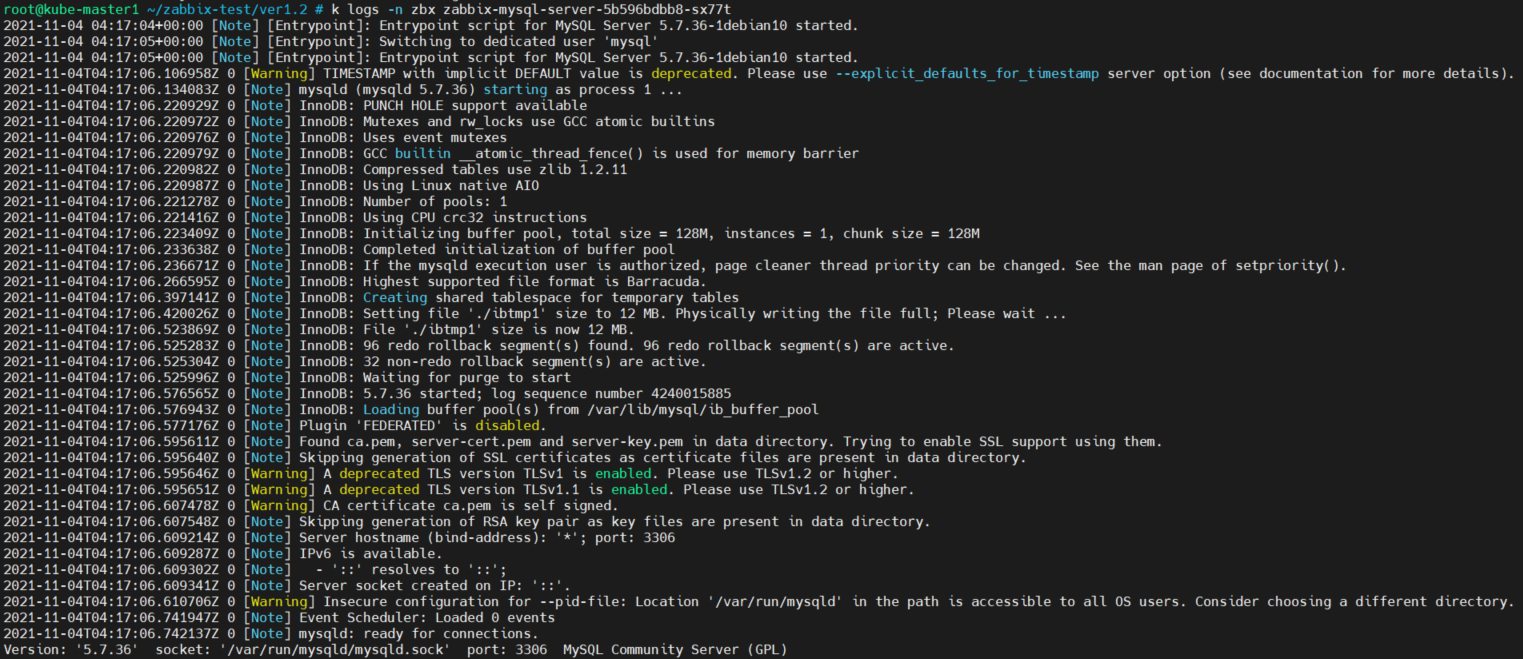
이렇게 Pod들을 다 올리고 mysql log와 zabbix server의 log을 찍어보면서 연동되는지 확인이 가능하다.
오류가 뜨면 해당 오류를 바탕으로 트러블슈팅을 진행하면 된다.(정상적으로 연동되면 아래와 같다)
3. Grafana 올리기
이제 Grafana를 올려줌으로써 최종적인 setting을 끝낸다.
Grafana는 설정을 올리기 위해 나는 volume을 3개로 잡아주었고, 알람 설정 시 그래프 이미지가 오기 위해 render을 올렸다.
Grafana의 yaml파일은 아래와 같다.
---
apiVersion: v1
data:
  GF_RENDERING_CALLBACK_URL: http://grafana-service:30004/
  GF_RENDERING_SERVER_URL: http://grafana-image-renderer:8081/render
kind: ConfigMap
metadata:
  creationTimestamp: null
  name: grafana-image-renderer
  namespace: zbx
---
apiVersion: apps/v1
kind: Deployment
metadata:
  labels:
    app: grafana
  name: grafana
  namespace: zbx
spec:
  selector:
    matchLabels:
      app: grafana
  template:
    metadata:
      labels:
        app: grafana
    spec:
      securityContext:
        fsGroup: 472
        supplementalGroups:
          - 0
      containers:
      - name: grafana
        image: grafana/grafana:8.2.0
        imagePullPolicy: Always
        ports:
          - containerPort: 30004
            name: http-grafana
            protocol: TCP
        envFrom:
        - configMapRef:
            name: grafana-image-renderer
        volumeMounts:
          - mountPath: /var/lib/grafana
            name: grafana-pv
          - mountPath: /usr/share/grafana
            name: grafana-pv-home
          - mountPath: /etc/grafana
            name: grafana-pv-ini
      volumes:
        - name: grafana-pv
          persistentVolumeClaim:
            claimName: grafana-pvc-claim
        - name: grafana-pv-home
          persistentVolumeClaim:
            claimName: grafana-pvc-claim-home
        - name: grafana-pv-ini
          persistentVolumeClaim:
            claimName: grafana-pvc-claim-ini
이미지를 불러오기 위한 render는 아래와 같다.
apiVersion: apps/v1
kind: Deployment
metadata:
  name: grafana-image-renderer
  namespace: zbx
spec:
  replicas: 1
  selector:
    matchLabels:
      app: grafana-image-renderer
  template:
    metadata:
      creationTimestamp: null
      labels:
        app: grafana-image-renderer
    spec:
      containers:
      - image: grafana/grafana-image-renderer
        name: grafana-image-renderer
        env:
        - name: IGNORE_HTTPS_ERRORS
          value: "true"
        ports:
        - containerPort: 8081
          name: http
          protocol: TCP
service도 마찬가지로 열어준다.
apiVersion: v1
kind: Service
metadata:
  name: grafana-service
  namespace: zbx
spec:
  ports:
  - port: 30004
    protocol: TCP
    targetPort: 30004
    nodePort: 30004
    name: http-grafana
  selector:
    app: grafana
  type: NodePort
image-render service도 열어준다.
apiVersion: v1
kind: Service
metadata:
  name: grafana-image-renderer
  namespace: zbx
spec:
  ports:
  - name: grafana-image-renderer
    port: 8081
    protocol: TCP
    targetPort: http
    nodePort: 30081
  selector:
    app: grafana-image-renderer
  sessionAffinity: None
  type: NodePort
3개의 pv, pvc는 다음과 같다.
# grafana-volume.yaml
apiVersion: v1
kind: PersistentVolume
metadata:
  name: grafana-pv
spec:
  capacity:
    storage: 10Gi
  accessModes:
    - ReadWriteOnce
  nfs:
    server: 192.168.16.142
    path: /nfs/grafana
---
apiVersion: v1
kind: PersistentVolumeClaim
metadata:
  name: grafana-pvc-claim
  namespace: zbx
spec:
  accessModes:
    - ReadWriteOnce
  resources:
    requests:
      storage: 10Gi
# grafana-volume2.yaml
apiVersion: v1
kind: PersistentVolume
metadata:
name: grafana-pv-home
spec:
capacity:
storage: 10Gi
accessModes:
- ReadWriteOnce
nfs:
server: 192.168.16.142
path: /nfs/grafana-home
---
apiVersion: v1
kind: PersistentVolumeClaim
metadata:
name: grafana-pvc-claim-home
namespace: zbx
spec:
accessModes:
- ReadWriteOnce
resources:
requests:
storage: 10Gi# grafana-volume3.yaml
apiVersion: v1
kind: PersistentVolume
metadata:
name: grafana-pv-ini
spec:
capacity:
storage: 1Gi
accessModes:
- ReadWriteOnce
nfs:
server: 192.168.16.142
path: /nfs/grafana-ini
---
apiVersion: v1
kind: PersistentVolumeClaim
metadata:
name: grafana-pvc-claim-ini
namespace: zbx
spec:
accessModes:
- ReadWriteOnce
resources:
requests:
storage: 1Gi
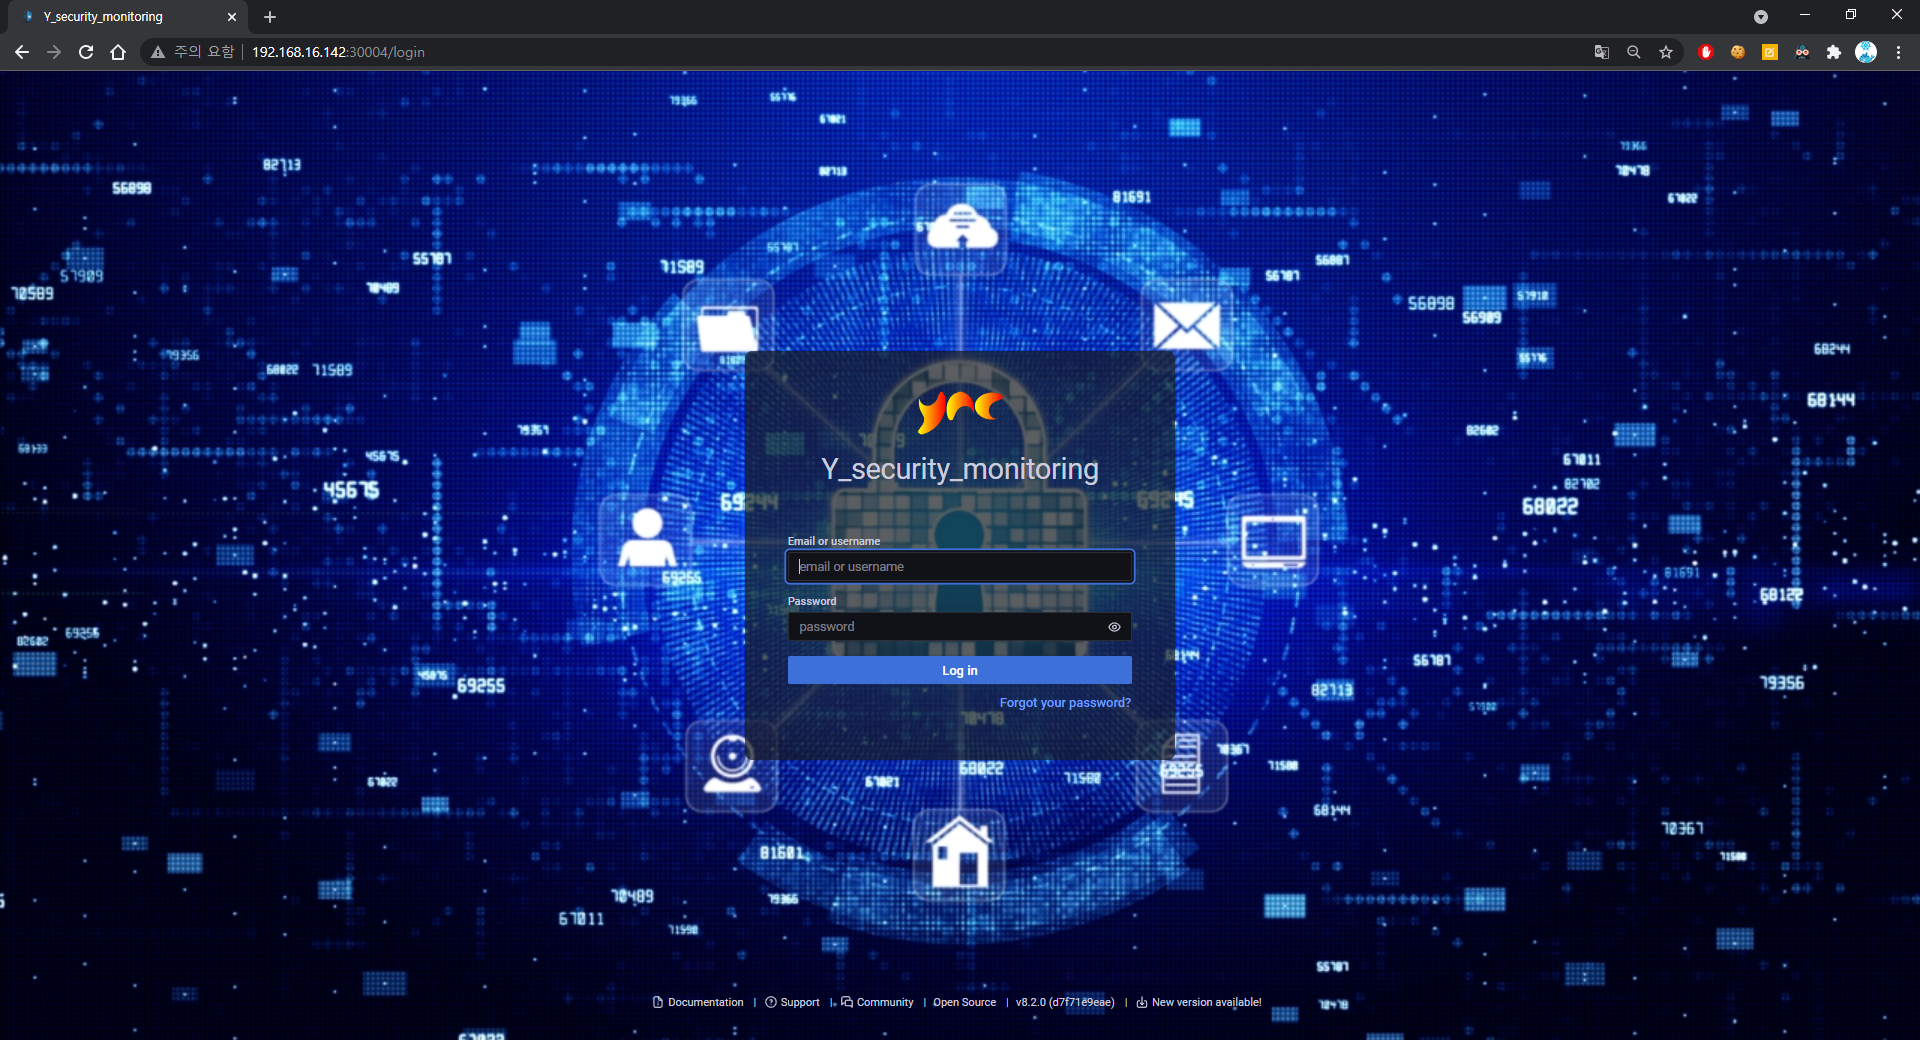
위의 Pod들을 쭉 올리면 Grafana로 접속할 수 있다.
나는 Grafana 내부 설정을 뒤져서 로고, 배경 같은 것들을 바꾸어주었다. 바꾸는 방법은 이전 포스팅에서 볼 수 있다.
4. React로 웹 올리기
React는 dockerfile로 작성한 후 docker build를 통해 docker hub에 저장하여 pull 받는 형식으로 배포하였다.
그래서 따로 코드는 없고 pull받는 간단한 yaml파일만 있다.
kind: Deployment
apiVersion: apps/v1
metadata:
  name: react
  namespace: zbx
spec:
  replicas: 1
  selector:
    matchLabels:
      app: react
  template:
    metadata:
      labels:
        app: react
    spec:
      containers:
        - name: react
          image: docker_hub/react:0.0
          imagePullPolicy: Always
          ports:
            - containerPort: 3000
service를 NodePort로 열어 외부 접속을 허용해준다.
kind: Service
apiVersion: v1
metadata:
  name: react
  namespace: zbx
spec:
  type: NodePort
  ports:
    - port: 3000
      targetPort: 3000
      protocol: TCP
      nodePort: 31000
  selector:
    app: react
5. 정리
이렇게 위의 yaml 파일들을 올리면 손쉽게 zabbix + grafana + react를 올리고, 각 Pod들을 연동하여 모니터링 시스템을 구축할 수 있다.
yaml파일에 미흡한 점도 많지만, 나름 두 달정도 프로젝트한 기록을 남김으로써 의미있게 보존하고싶다.
github에는 full yaml을 올림으로써 누군가 도움이 되었으면 좋겠다.
6 . 참조
---zabbix snmptrap 설정---
https://blog.zabbix.com/snmp-traps-in-zabbix/8210/
https://sbcode.net/zabbix/snmp-traps/
https://www.youtube.com/watch?v=fVK2YWdTalQ&ab_channel=DmitryLambert
---Grapana 설치 및 오류관련---
https://github.com/grafana/grafana/issues/36443
https://github.com/algenty/grafana-flowcharting
https://github.com/grafana/grafana/issues/36563
https://github.com/grafana/grafana/issues/26485 --> 서명되지 않은 플러그인 인증하는 (Unsigned plugins will not loaded)
https://limm-jk.tistory.com/48 --> permission 오류
-----------------Container-----------------
https://programming.vip/docs/k8s-deployment-zabbix-monitoring-system.html --> zabbix mysql 관련 설정
https://www.zabbix.com/container_images --> Zabbix Docker Component Repositories
https://waspro.tistory.com/580 # metadata-labels-name 지정
https://server-talk.tistory.com/295 # mariaDB설정파일
https://hub.docker.com/r/zabbix/zabbix-server-mysql
https://hub.docker.com/r/zabbix/zabbix-server-mysql/tags/?page=1&ordering=last_updated # docker hub
https://hub.docker.com/r/zabbix/zabbix-agent
https://hub.docker.com/r/zabbix/zabbix-web-apache-mysql
https://hub.docker.com/r/zabbix/zabbix-snmptraps
https://www.zabbix.com/documentation/current/manual/appendix/config/zabbix_server # zabbix_server_conf 변수설명
----------------------Grafana SMTP 설정 ----------------------
https://techexpert.tips/ko/grafana-ko/grafana-%EC%9D%B4%EB%A9%94%EC%9D%BC-%ED%86%B5%EC%A7%80-%EC%84%A4%EC%A0%95/ --> Linux SMTP + Grafana
https://grafana.com/docs/grafana/latest/administration/configure-docker/ --> grafana volume 설정
--------------------- alert ---------------------
https://devthomas.tistory.com/27 # alert no data 관련 이슈해결?
https://danawalab.github.io/common/2021/01/26/Common-Grafana-Alert.html # alert 메뉴설명
7 . github
https://github.com/anfrhrl5555/zabbix_grafana
'Cloud > Project' 카테고리의 다른 글
| kubernetes project -7- (2) | 2021.11.05 |
|---|---|
| kubernetes project -6- (0) | 2021.10.24 |
| kubernetes project -5- (0) | 2021.10.21 |
| kubernetes project -4- (0) | 2021.10.16 |
| kubernetes project -3- (0) | 2021.10.14 |


